Major research findings involving Swiss needle cast and its causal agent:
- Fertilizer influence on SNC disease severity across a gradient of disease: The Beyond N Study
- Effects and Impacts of SNC
- SNC Treatments
- Quantification, Assessment, and Severity Prediction
- Tree Genetics, Resistance, and Improvement
All cited publications are available on our Publications page.
The ability to quantify the biomass of Phaeocryptopus gaeumannii in Douglas-fir needles is important for ecological and epidemiological research on Swiss needle cast (SNC), evaluation of host-resistance, and investigation of foliage infection and colonization. Pseudothecial density measures (i.e. fruiting body abundance), are well correlated with disease symptoms, such as chlorosis and needle retention, but are extremely time consuming and tedious, and can be subject to errors in measurement (Winton et al. 2003). Measures of ergosterol content (a component of fungal cell walls) can be a good measure of fungal biomass in Douglas-fir, but is not fungal species specific and can be influenced by presence of other fungal species (Manter et al. 2001; Winton et al. 2003; Fig. 1A). This method is sensitive enough to quantify P. gaeumannii prior to presence of pseudothecia, and is relatively inexpensive, rapid, and allows for the simultaneous analysis of many samples (Winton et al. 2003). The dot blot hybridization technique, which detects specific fungal DNA sequences, has the potential to be more specific than ergosterol measurements, but has been shown to cross-react with fungal species closely related to P. gaeumannii (Winton et al. 2003). This limits the utility of the dot blot hybridization technique when similar fungal species are present in high quantities. Real-time quantitative polymerase chain reaction (QPCR) techniques have the advantage of speed, simplicity and specificity (Winton et al. 2003; Fig. 1B). However, some of the required chemicals are costly, and there is evidence that DNA degradation of older samples or cultures may affect the accuracy of this technique. Nonetheless, this technique is able to detect and quantify P. gaeumannii early in the disease cycle (Winton et al. 2003), and works well in both heavily infected and apparently healthy foliage (Winton et al. 2002). This method can also be applied to simultaneously quantify host and pathogen DNA, to derive a relative measurement of pathogen colonization of host tissue (Winton et al. 2002; Fig. 1C).
The visual and physical assessment of SNC severity has been accomplished on a larger scale by developing maps (Fig. 1D) from annual aerial surveys in conducted annually in Spring from 1996 to 2006 by the Oregon Department of Forestry (Hansen et al. 2000). Flights are made at 450 to 600 meters above the terrain, following a north-south flight path extending from the Oregon coast eastward until symptoms are no longer visible (Hansen et al. 2000). Polygons of infected patches are drawn onto topographic maps and classified as either heavy (brown foliage and very sparse crowns) or moderate (yellow-yellow brown foliage with slightly denser crowns (Hansen et al. 2000). Low levels of disease cannot be detected from the air.
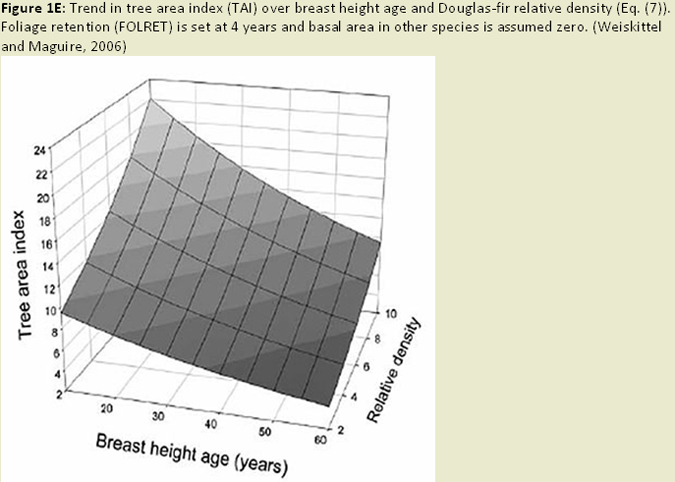
At a more local scale (e.g. stand and ownership scale), ratings of needle retention, chlorosis (needle discoloration), and P. gaeumannii sporulation have been made at the plot level (Hansen et al. 2000). Needle retention has been the primary assessment tool for foresters on the ground. Needle retention is estimated on a scale from 0 to 9 (0=0-9% of needles retained and 9=90-100% of needles retained) (Hansen 2000). This score is calculated for each annual set of needles, and can be done for as many years of needles as remain on the tree. The total score for all years is then divided by the number of years to obtain a score for the tree. Maguire and others (2002) have simply divided the tree into thirds and averaged the number of needle age classes present from a secondary or lateral branch for each third. Variations on these methods have been used to determine disease severity in other studies (e.g. Rosso and Hansen 2003; Mainwaring et al. 2005). In addition, other parameters, such as foliage mass, ratios of crown measurements to sapwood area, sapwood moisture content, branch surface area and distribution, and tree basal area or growth measurements, have been used to assess the impacts of SNC (Maguire et al. 2002; Weiskittel et al. 2006; Mainwaring et al. 2005; Maguire and Kanaskie 2002; Weiskittel and Maguire 2007; Fig. 1E).
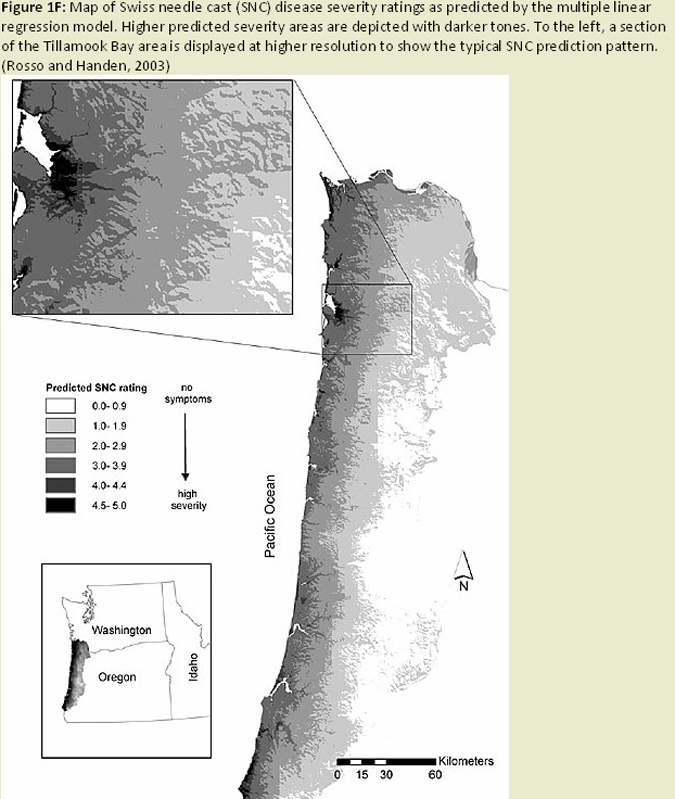
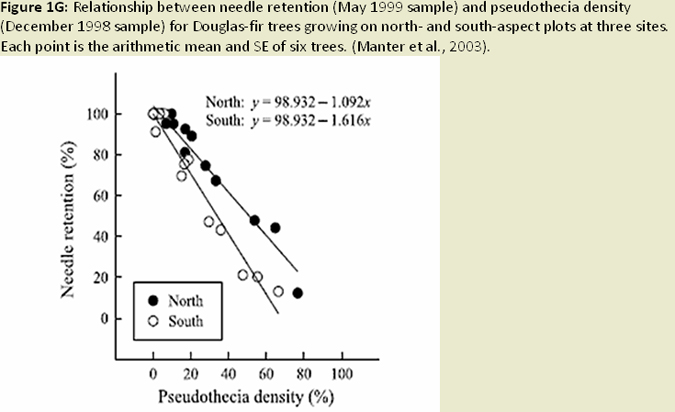
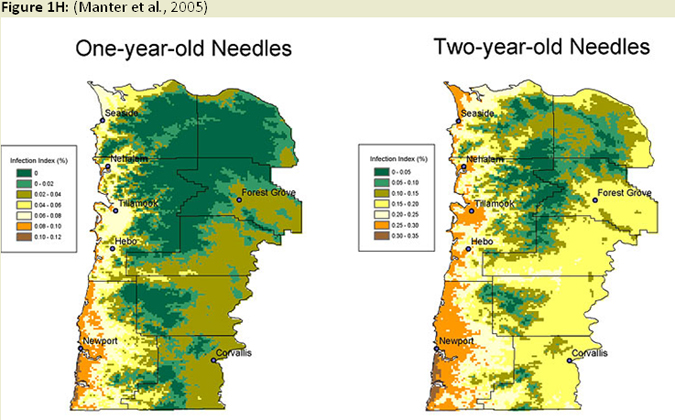
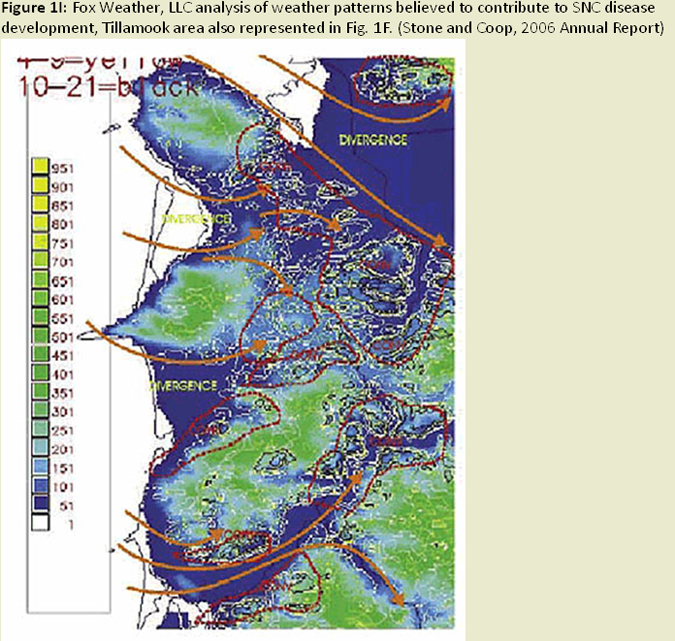
Temporal and spatial variation in disease severity has been noted since the early 1990's, and modeling this variation has become a recent focus of research efforts. Initial efforts of developing prediction models (Ross and Hansen 2003) indicated fog occurrence, precipitation, temperature, elevation, and slope aspect were all important factors in predicting severity of the disease. (Fig. 1F) The number of ascocarps (pseudothecia) on tree foliage was also shown to be correlated with temperature, specifically winter temperatures, and leaf wetness in the spring affecting development of the P. gaeumannii, and over time could lead to differences in severity of SNC (Manter et al. 2005). It has also been found that fungal abundance and symptom expression is greater on warmer south-facing (western coast range) and north facing (eastern coast range) slopes (Manter et al. 2003), (Fig. 1G) presumably due to increased excess light energy at these higher light levels. Using this type of information, as well as information on dynamics of infection and colonization, a climate based disease prediction model is being developed in combination with GIS linked climate databases (Fig. 1H) to estimate disease levels across an affected portion of the Oregon Coast Range (Manter et al. 2005). Stone and Coop (2006 annual report) are pursuing a model using climate-topography relationships affecting coastal cloud, fog, and drizzle, in combination with fungal epidemiology to develop spatial models for predicting SNC distribution and severity. (Fig. 1I) These models will be useful for hypothesis testing in future studies (e.g. disease spread and intensity with climate change, affects on regional carbon budgets), as well as a decision support tool for forest managers dealing with SNC.
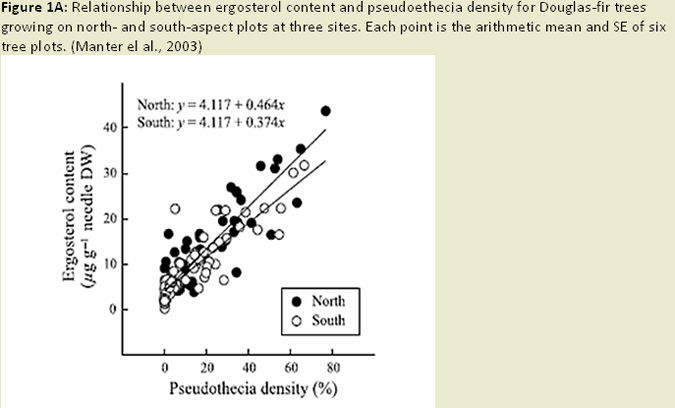
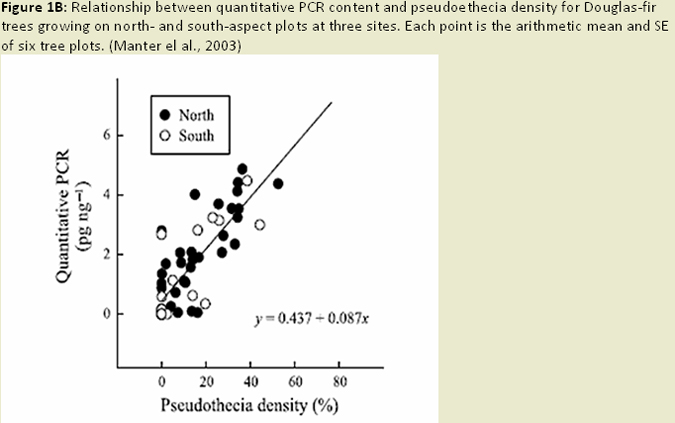
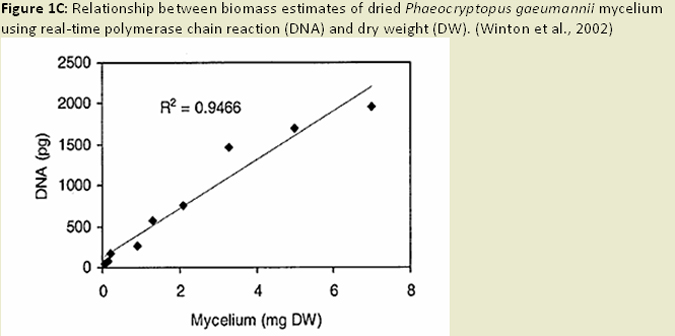
Figure 1D - Click here for detailed maps from the aerial survey